A Quality Management Perspective on the Abortion Battle
Can Data Bridge the Divide? The Rule of 7 and Public Policy
Quality Leadership aims to support continuous improvement toward “a more perfect Union” by leveraging the intersection of Citizenship, Quality Management, and Christianity.
The intent of this post is twofold:
To introduce a simple standard - The Rule of 7 - for interpreting trends in a Run Chart.
To provide a framework for determining when changes in law, policy, or strategy actually result in a measurable “improvement.”
Can Data Bridge the Divide?
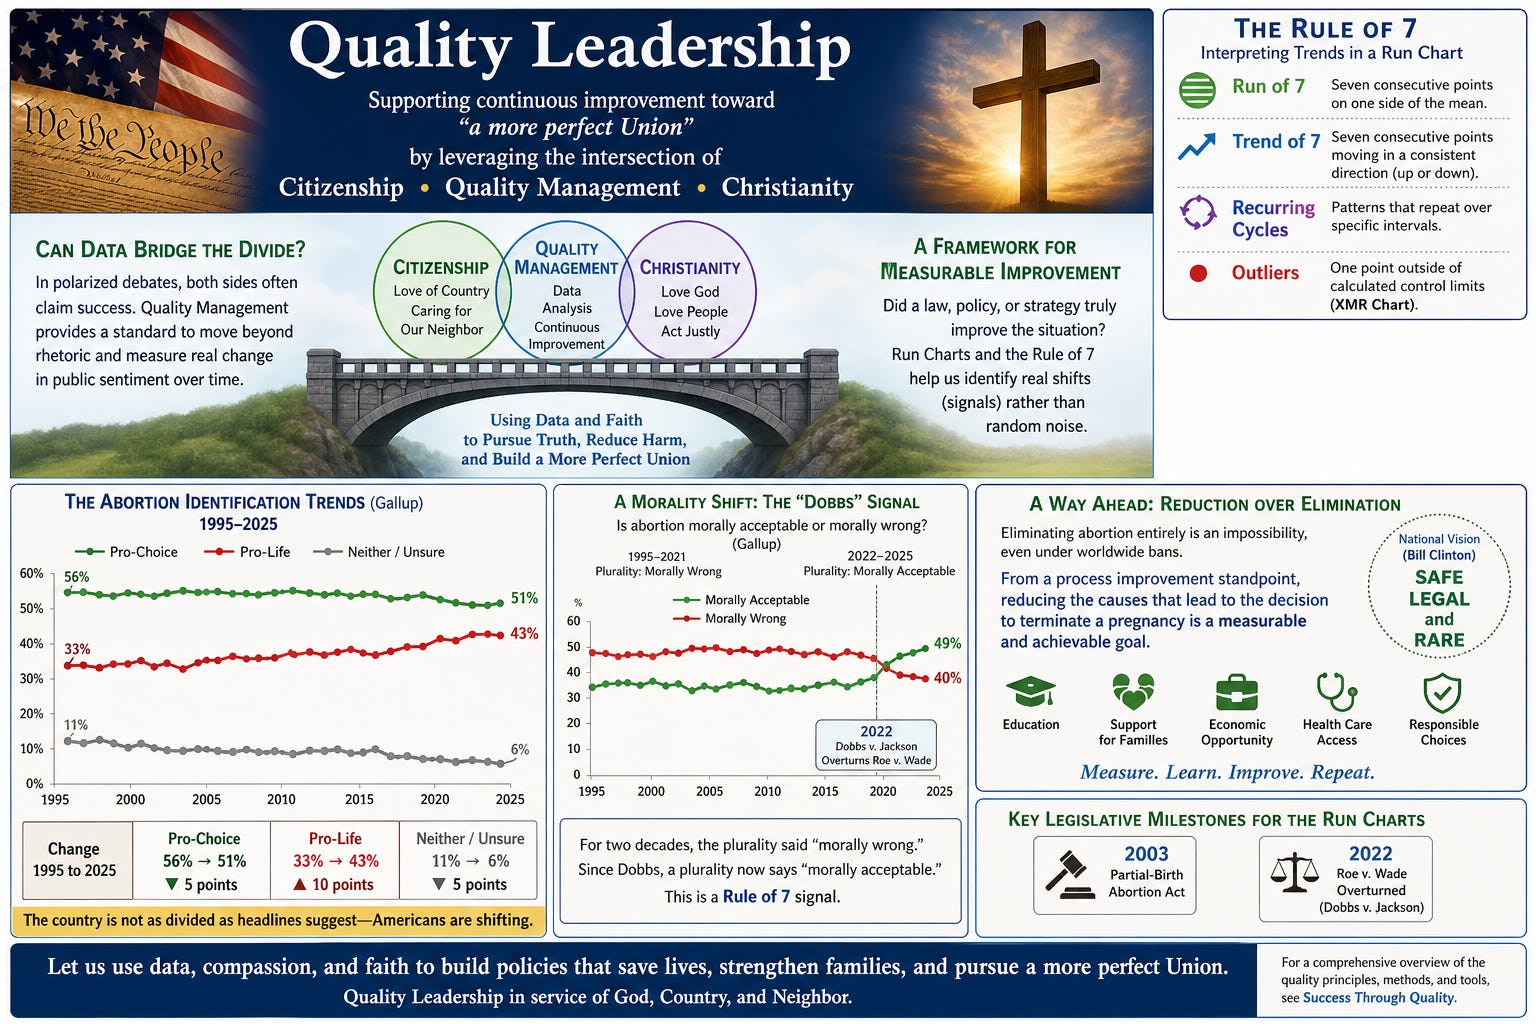
From a Quality Management perspective, how do we determine if a change is truly an improvement? In the polarized debate over abortion, both sides often claim success in persuading the public. However, without a standard for measurement, these claims are often anecdotal.
By applying quality technology to controversial issues, we can move past rhetoric and look at the actual shifts in public sentiment over time.
Understanding the “Rule of 7”
When viewing Gallup Survey data from 1995 to 2025, we often encounter “Run Charts” (data plotted over time). While Gallup provides the data, they rarely mention the generally accepted standards for interpreting these charts. To identify a real statistical shift rather than “noise,” one of the more memorable standards is the Rule of 7.
A non-random change (a “signal”) is indicated by:
A Run of 7: Seven consecutive points on one side of the mean.
A Trend of 7: Seven consecutive points moving in a consistent direction (up or down).
Recurring Cycles: Patterns that repeat over specific intervals.
Outliers: One point falling outside of calculated control limits (when using an XMR Chart).
The Myth of the Abortion Divide
In the article The Myth of the Abortion Divide, author Andrea Jones-Rooy suggests that while the country is divided, the consensus is more nuanced than headlines suggest. As of 2025:
“Slightly more than half of Americans identify as pro-choice.”
“60% of Americans think abortion should be legal in all or most cases.”
However, the long-term trend (1995–2025) reveals a shifting landscape:
Pro-Choice identification: Dropped from 56% to 51%.
Pro-Life identification: Increased from 33% to 43%.
Neither/Unsure: Dropped from 11% to 6%.Comparing the survey data from 1995 to 2025 offers another perspective:
A Morality Shift: The "Dobbs" Signal
According to Gallup's Gender Gaps on Abortion Reach Historic Highs, the 2022 Dobbs decision—which overturned Roe v. Wade—led to a shift in the data. For two decades prior, the plurality of Americans labeled abortion "morally wrong." Since the Dobbs ruling, the data has shifted: a plurality now consistently labels it "morally acceptable" (49% vs. 40%).
Fact Sheet, March 2026, Abortion in the United States
An estimated 1,126,000 abortions were provided by US clinicians in 2025 …. an increase of 21% from 2020, the last year of comprehensive national estimates before Dobbs. This count includes medication abortions provided via telemedicine by US clinicians, including those provided under the protection of shield laws to patients in states with total bans. It does not include self-managed abortions, such as those using medications mailed from pharmacies outside the United States or sourced from community networks. Evidence suggests self-managed abortions have increased since Dobbs
Abortion Issue: A Political Litmus Test
The Pro-Life Democrat Is a Politically Endangered Species, But a Pro-Choice Republican is much more viable, Ryan Burge May 11, 2026
The conventional wisdom in American politics holds that abortion is a litmus test issue. Simply stated, Republicans must be pro-life and Democrats must be pro-choice to survive in their respective primaries. Let alone a general election.
First, let me just show you a couple of graphs that lay out the long term trends surrounding access to abortion. Since 1977, the GSS has been asking, “Do you think it should be possible for a pregnant woman to obtain a legal abortion if the woman wants one for any reason?” The trend is certainly in the pro-choice direction.
Every Christian group has moved to the pro-choice side on this question over time.
But I have to point out those Black Protestants. Their line looks like no other trend in this graph. …. in 2008, about 35% of Black Protestants favored abortion access. That figure in 2024? It was 67%.
To summarize:
Pro-Choice voters went from D+40 to D+58 between 2016 and 2024.
Pro-Life voters went from R+49 to R+80 between 2016 and 2024.
A Way Ahead: Reduction Over Elimination
Eliminating abortion entirely is an impossibility, even if there were worldwide bans. However, from a process improvement standpoint, reducing the causes that lead to the decision to terminate a pregnancy is an achievable and measurable goal.
This aligns with the national vision once proposed by Former President Bill Clinton: that abortion should be “Safe, Legal, and Rare.”
End Notes
Key Legislative Milestones for the Run Charts:
2022: Roe v. Wade Overturned (Dobbs v. Jackson)
For a comprehensive overview of the quality principles, methods, and tools, see Success Through Quality: Support Guide for the Journey to Continuous Improvement.
An article written in the late 90s and updated in 2000. Applying the quality technology to help resolve controversial issues, such as abortion